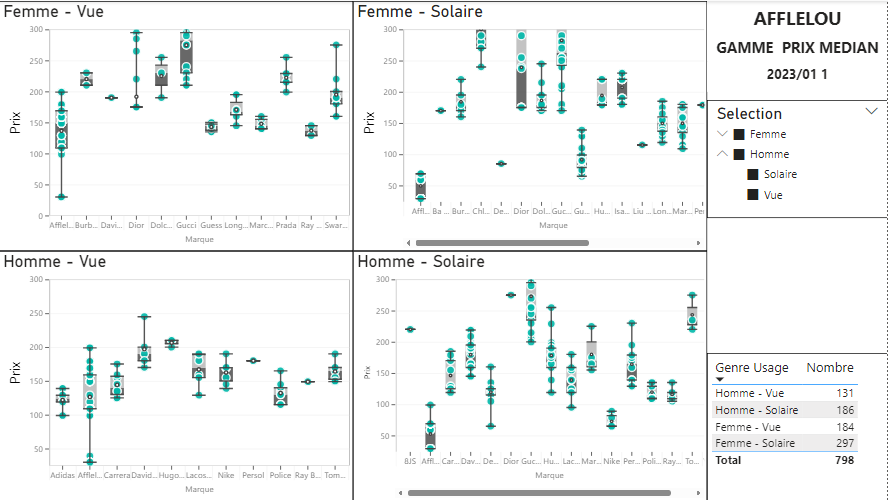
For each manufacturer, statistical study of prices displayed by::
– eyeglasses / sunglasses
– gender
The boxplot represents the dispersion of prices
– median (50% below, 50% above the figure)
– the box encapdulates 50% of occurrencies
On the right; number of products
– eyeglasses / sunglasses
– gender
